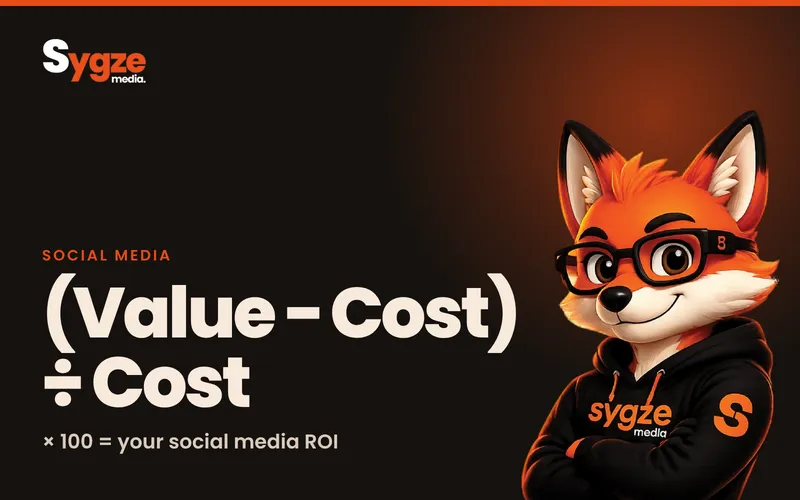
To measure social media ROI, subtract your total social media cost from the revenue or lead value you can trace to social, divide by that cost and multiply by 100. The tracing is the real work: tag every link with UTM parameters, record your main conversion as a key event in Google Analytics, and check which social leads became paying customers in your CRM. Do that the same way every month and you will have a number you can defend.
Social media is easy to report and hard to prove. Likes, reach and follower counts go up and to the right, while the person paying for it asks a simple question: what did we get back? This guide shows how to measure social media ROI properly, with a setup a small team can run every month.
What social media ROI actually means
Social media ROI is the value you can trace to social media, minus everything it cost, divided by that cost and shown as a percentage. It only means something if the value is real revenue or leads, not impressions, and the cost includes ads, the cost of social media management, staff time, content and tools.
Return on investment compares what you gained with what you spent. For social media, the formula is simple:
Social media ROI = (value generated − total cost) ÷ total cost × 100
The hard parts are the two inputs. "Value generated" must be revenue or leads you can connect to social, not impressions. "Total cost" must include everything: ad spend, agency or freelancer fees, staff time, content production, tools and any influencer fees. Leaving out costs is the most common way social ROI gets exaggerated.
You are not alone if this feels harder than it should. In Sprout Social's 2025 research, 68% of marketing leaders said they look at engagement to define social ROI, ahead of conversions (65%) and revenue (57%). Engagement is useful, but it is not money, so the rest of this guide focuses on getting from engagement to revenue.
Step 1: Choose one primary conversion
Before measuring anything, decide what a successful outcome is for your business. Pick one primary conversion and a few secondary ones.
- E-commerce: purchases and revenue.
- Service businesses: booked calls, quote requests or qualified leads.
- B2B: demo requests or sales-qualified leads.
- Early-stage brands: email or newsletter sign-ups, as a measurable step towards sales.
Everything else (engagement, saves, shares, follower growth) is a leading indicator. It tells you whether content is working, but it isn't ROI.
If your conversion is a lead rather than a sale, give it a value. Take your average first-order value and multiply it by the share of leads that usually become customers. If an average job is worth $600 and one in four leads buys, each lead is worth about $150. That lets you calculate ROI before the sales cycle finishes.
Step 2: Tag every link with UTM parameters
UTM parameters are small tags added to the end of a link that tell Google Analytics where a visit came from. Without them, much social traffic is lumped together or appears as direct traffic.
- utm_source: the platform, for example instagram, facebook, linkedin or tiktok.
- utm_medium: the type of traffic, for example social for organic posts and paid_social for ads.
- utm_campaign: the campaign or content theme, for example spring_launch.
- utm_content (optional): the specific post or creative, useful for comparing formats.
The medium values matter more than they look. Google Analytics files a visit under Organic Social when the medium is a value such as social or social-media, and under Paid Social when the source is a social site and the medium starts with paid or matches values such as cpc or ppc. If you invent your own medium names, your social traffic can end up in the Unassigned channel.
Use Google's free campaign URL builder, keep names lowercase and consistent, and record every tagged link in a shared sheet. Use your tagged links in bios, link stickers, ads and posts.
Step 3: Connect social to Analytics and your CRM
In Google Analytics, mark your primary conversion as a key event (for example a purchase, a form submission or a WhatsApp click). You can do this in Admin, under Events, by clicking the star next to the event. A standard property allows up to 30 key events, and marking one only counts from that point forward, so set it up before your campaign starts, not after. Reports can take up to 24 hours to show new key events.
Then check the traffic acquisition and key event reports filtered by session source and medium. You'll see how many conversions each platform drove.
For lead-based businesses, the CRM is where ROI becomes real. Make sure each lead records its source, then check which social leads became paying customers and how much they spent. A channel that sends fewer but better leads often wins.
Platform dashboards (Meta, TikTok, LinkedIn) will usually report more conversions than Analytics, because each platform counts views and clicks in its own way. Use platform numbers to optimise ads, and Analytics or the CRM to report ROI, so each sale is only counted once.
Step 4: Measure assisted value, not just last clicks
Many customers see a brand on social media several times, then search for it on Google or type the website directly before buying. A strict last-click view gives social almost no credit for those sales. Sprout Social's 2025 Index found that 81% of consumers say social media sways them into spontaneous purchases several times a year, and many of those journeys will never show up as a neat click.
- Watch branded search: growing searches for your brand name in Search Console often follow strong social activity.
- Check direct and returning visits during big campaigns.
- Ask customers how they heard about you on forms and at checkout. A simple dropdown gives you data no tracking tool can.
- Use Analytics' attribution reports (Advertising, then Attribution) to compare data-driven attribution with paid and organic last click, and to see the paths people take before converting.
Report these as supporting evidence alongside direct ROI, not as a replacement for it.
Step 5: Calculate ROI the same way every month
Here is a simple example. A service business spends $1,500 a month on social media in total: management, content and a small ad budget. Tracked social leads bring in 6 new customers with an average first job of $600, so $3,600 in revenue.
ROI = ($3,600 − $1,500) ÷ $1,500 × 100 = 140%
If customers come back or stay for months, use customer lifetime value instead of the first order. That usually shows the real return more fairly, especially for subscription and repeat-purchase businesses. Whichever you choose, write the method down and keep it, so this month can be compared with last month.
Examples by business type
The formula stays the same, but what counts as value changes. These worked examples use illustrative numbers to show the method.
Online shop
Value is tracked revenue from social sessions in Analytics, ideally checked against your store's order report. If social sessions produced $8,000 in sales and total social cost was $2,000, ROI is 300%. Look at gross margin too: revenue-based ROI can look healthy while profit is thin.
Local service business
Value is booked jobs. Track calls, WhatsApp clicks and quote forms as key events, and ask every new customer where they found you. Phone and walk-in leads are easy to lose, so a "how did you hear about us" question at booking is often your most reliable data.
B2B company
Sales cycles are long, so measure pipeline value first and closed revenue later. Record the original source of each lead in the CRM, then report social-sourced pipeline monthly and social-sourced revenue each quarter.
Restaurant, salon or clinic
Value is bookings and redemptions. Use a dedicated booking link with UTM tags in your bio and a platform-specific offer code, so you can count how many visits came from each channel.
Step 6: Report it in a way leadership trusts
A good monthly social report fits on one page and answers four questions:
- What did we spend? Every cost, in one number.
- What did we get? Conversions and revenue or pipeline from social, from Analytics or the CRM.
- What is the ROI or cost per result, compared with last month and with other channels?
- What did we learn, and what will we change next month?
Put engagement metrics underneath as context, not at the top. When leadership sees cost and revenue first, social stops being a mystery line in the budget.
Monthly ROI checklist
- Confirm every link used this month carried UTM tags, and fix any that didn't.
- Add up total cost: ad spend, fees, staff hours at an hourly rate, content and tools.
- Pull key events and revenue by session source and medium from Analytics.
- Match social leads to closed sales in your CRM.
- Calculate ROI and cost per result by platform.
- Note branded search trends and "how did you hear about us" answers as supporting evidence.
- Write two or three lessons and one change for next month.
Metrics worth tracking in 2026
- Cost per lead or cost per purchase by platform
- Conversion rate from social visits
- Revenue or pipeline from social, by campaign
- Branded search growth in Search Console
- Saves, shares and comments per post (better signals of interest than likes)
- Video completion rates for reels and short video
Tools that make this easier
- Google's campaign URL builder, for consistent UTM links.
- Google Analytics, for key events, channel reports and attribution comparisons.
- Google Search Console, for branded search trends.
- Your CRM (HubSpot or similar), for tracking lead source through to revenue.
- Native platform analytics, or a scheduling and analytics tool such as Sprout Social, Hootsuite or Buffer, for post-level performance in one place.
- A shared spreadsheet, for the cost log and the monthly ROI calculation.
Common mistakes
- Reporting reach and followers as results.
- Leaving staff time, content costs or tools out of the cost.
- Using untagged links, so social traffic shows up as direct.
- Using made-up UTM medium names, so visits land in the Unassigned channel.
- Adding up conversions from every platform's dashboard and counting the same sale twice.
- Setting up key events after a campaign has started, so early results are never recorded.
- Changing the measurement method every month, so trends can't be compared.
Frequently asked questions
What is a good social media ROI?
Any ROI above 0% means social media earned back more than it cost, but a good figure depends on your margins and what other channels return. Compare social with your search, email and referral results using the same cost method. Improving your own number month on month matters more than an industry average.
How long does it take to see ROI from social media?
Paid social can show measurable results within weeks. Organic social usually takes several months, because audiences and trust build slowly. Give any new approach at least three months of consistent tracking before judging it.
Can you measure ROI from organic social media?
Yes, as long as your bio links, story links and post links carry UTM tags and your conversions are set up as key events. Organic social also drives branded search and word of mouth, so add those signals as supporting evidence.
Why do Meta or TikTok show more conversions than Google Analytics?
Each platform uses its own attribution rules, often counting people who saw an ad but did not click, and each one only sees its own touchpoints. Google Analytics counts each conversion once across all channels. Use the platform figures to optimise campaigns and Analytics or your CRM to report ROI.
Should staff time count as a cost?
Yes. Multiply the hours spent on planning, creating, posting and replying by a realistic hourly rate. Leaving it out makes organic social look free, which hides its true return.
Start this month
Pick your primary conversion, tag every link, set up the key event in Analytics and agree on the cost number. After one month you'll have a baseline; after three you'll know which platforms and content types pay for themselves.
If you'd like a second pair of eyes on your tracking, message Sygze Media on WhatsApp for a free 10-minute audit of your social media measurement setup.
Sources
- Google Analytics Help: URL builders, collect campaign data with custom URLs
- Google Analytics Help: Mark events as key events
- Google Analytics Help: Default channel group
- Google Analytics Help: Get started with attribution
- Sprout Social: Social media marketing ROI statistics